Understanding how the smoke limiter maps work is the most important ingredient of "new school" remapping.
As the name might suggest the smoke limiters limit the amount of fuel the engine can inject at any combination of airmass and rpm.
The airmass value calculated from either MAP/IAT (10P motors) or MAF/RPM (15P motors) is indicative of the current load.
Air Fuel Ratio as a tool
It's important to note that the discussion of Air Fuel Ratio that follows is a way of understanding the relationship between the airmass given in the smoke limiters x-axis and the Inject Quantity in the table cells. The amount of fuel injected is still the "thing" we are interested in.
Air Fuel Ratio
All fuels have a ratio of air at which combustion is most complete at the end of the combustion cycle. This ratio is called the stoichiometric AFR, and for diesel engines this is 14.5, which means that diesel 1 quantity of diesel will optimally combust in 14.5 quantities of air. While petrol engined vehicles can run at stoichiometric AFR (or Lambda = 1) due to the volatile nature of the fuel, the lower volatility of diesel fuel and the relatively slow burn that results in incomplete combustion and smoke when stoichiometric AFR is used. So diesels must run lean to ensure complete combustion and avoid smoke.
The name Smoke Limiter reflects the map function of restricting the amount of fuel injected to control incomplete combustion and the resulting cloud of black smoke based on the amount of air available in the cylinder.
AFR and Inject Quantity
Fortunately it is a very simple to determine the Inject Quantity or Air Fuel Ratio if you know one of the two values and the Airmass.
- IQ mg = Airmass mg / AFR
- AFR = Airmass mg / IQ mg
These two formula can be used to determine either the AFR set at specific location in cell, or to determine the IQ required to give a desired AFR.
Provided the inject duration maps accurately reflect the injector performance the IQ should be close to the amount of fuel injected under normal operational conditions.
The maps
- X axis: Airmass (mg/stroke) (move decimal 1 place left)
- Y axis: Engine Speed (RPM)
- Z axis: Inject Quantity (mg/stroke) (move decimal 2 places left)
10P
All 10P fuel maps -- MSB and NNN -- have a single primary smoke limiter map.
- Smoke Limiter
15P
There are three primary smoke limiter maps in 15P fuel maps. These are:
- Smoke Limiter- Lo Range
- Smoke Limiter - Hi Range
- Smoke Limiter - Hi Dynamic
Smoke Limiter - Hi Range is the primary map, with Smoke Limiter - Hi Dynamic to smooth throttle response in transient conditions. When throttle transients occur the ECU ramps between Smoke Limiter - Hi Dynamic and the main "Smoke Limiter - Hi Range" with the ramp time dependent on change in throttle position.
Table Data
So lets have a look at what this means in practice with a randomly selected stock 15P map.

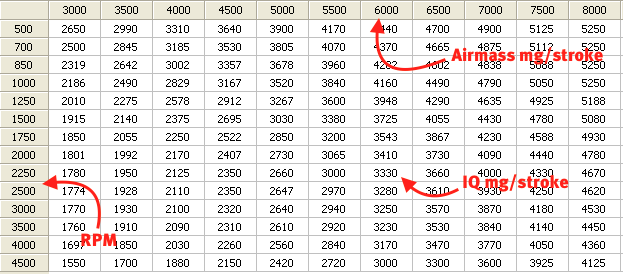
You can see that the X axis header contains values 3000, 3500, and from the axis descriptions above, we can see this is actually Airmass (mg/stroke) with values 300.0, 350.0 and so on. The Y axis is Engine Speed (RPM), and is correct as is. The body of the table is IQ (mg/stroke) and needs to be divided by 100 to bring to correct units meaning the value point by the arrow accompanying the IQ description is 33.30mg/stroke.
Continuing with the 33.30 cell, we can see this is at the intersection of Airmass of 600.0 mg/stroke, and Engine Speed of 2250 rpm.
From the Airmass and IQ we can now determine the AFR this cell is set.
AFR = 600 /33.3
AFR = 18.018
Hand calculating is fine for the odd cell but it's more useful to use something like Excel, Octave, R or MATLAB to work with the table data, especially when it comes to displaying, plotting or modifying large numbers of cells.

With the map displaying AFR values it's possible to get a better sense of the maximum fuelling that can be requested using the stock map. The actual injection quantity used will be determined by the Driver Demand and Torque Limiters.
I need to stress that we are simply using the AFR as a tool to set the maximum IQ (mg/fire). This does not mean we are tuning based on AFR.
Getting a fix on where you are on the (smoke) map.
In the Airmass post I talked about calculating airmass from MAP/IAT or MAF/RPM.
Equiped with log information giving RPM and the calculated airmass value, we can now locate exactly where on the smoke map the engine is running.
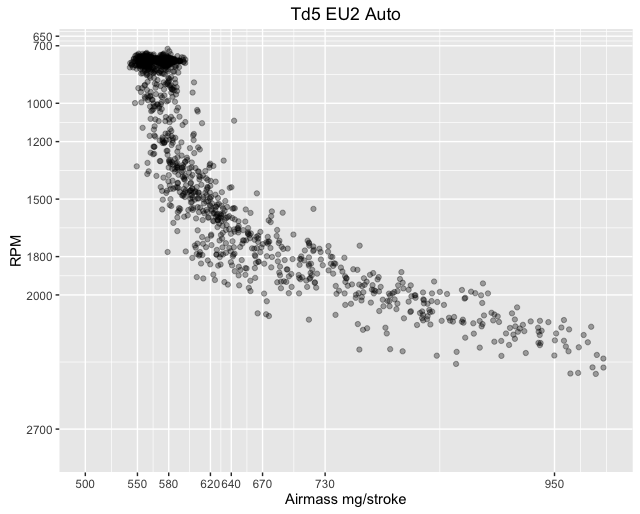
To illustrate, I've used R/RStudio to import a Nanocom log, then added a calculated column containing the airmass (map/iat). By plotting the Airmass vs RPM with the breaks set to match the axis values of the smoke map the areas of the map which are being "hit" while driving became very obvious.
As can be seen, the Auto Td5 operates in a fairly narrow band.
This example is from a test map which has had the Airmass axis extended slightly from 850mg to 950mg.

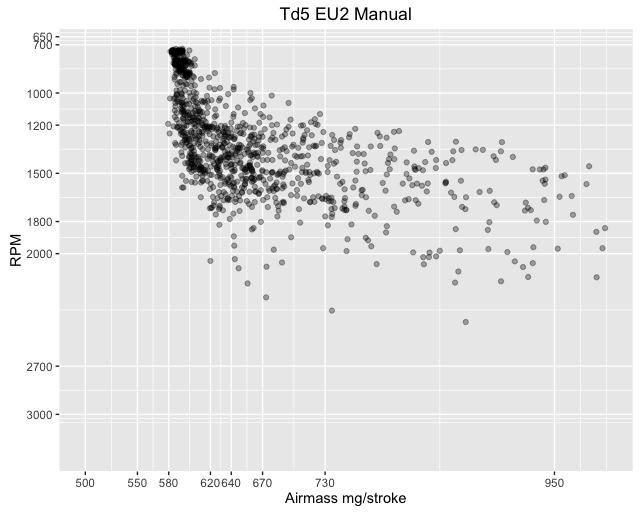
A manual gearbox results in a very different path through the smoke map.
The log comes from a vehicle running a popular eBay chip, with boost increased above stock.

