
How map tables work…
It’s not entirely obvious how the individual tables are used in the Td5 ECU, and I don’t think I’ve explained this anywhere else.
The Basics
All tables are looked up using linear interpolation. This is done by searching along an axis to find the values on each side of the target value.
If the target value is lower than the minimum or higher than the maximum the nearest “edge” is used.
Using a EU3 torque limiter table as an example this would mean an engine speed value of 500 rpm (which would only occur when cranking) would be clamped to the 600 rpm column, while a value of 5500 rpm (possible but unlikely) would be clamped to the 5000 rpm column.
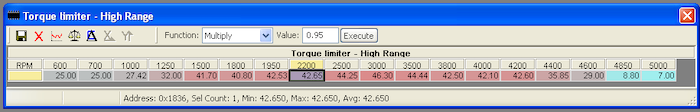
If the target value was within the bounds of the table, say 2400 rpm, the value would determined by finding the axis values immediately above and below - 2200 rpm and 2500 rpm.
The interpolation between column values is done by finding the fraction of the difference between the column values at which the target value falls.
$$\frac{2400 - 2200}{2500 - 2200} = \frac{200}{300} = 0.66666$$
Then the difference between the table value for 2200rpm and 2500rpm is multiplied by the fraction to determine the value off the fraction.
$$(44.25 - 42.53)0.6666 = 1.15$$
And finally the lower column value is added to the fractional value to give the limter value at 2400rpm.
$$42.53 + 1.15 = 43.68$$
Essentially the method assumes there is a straight line (hence the linear) joining the points represented by the x-axis and table values.
Higher Dimensions
The same basic principles are applied to 2 and 3 dimensional tables. With 2 dimensional tables the ECU interpolates on both the x and y axis, with the column and row values representing the four corners of a cell. If you look at the graph view of a 2d table the intersections of grid lines represent cell corners and the flat surfaces that fill the cells are all the possible interpolated values that occur between the corner values.
Two sets of tables are actually 3d tables. These are the fuel temp compensation tables, and the inject duration tables.
With these tables there is a hidden third dimension - rpm in the case of fuel temp, and advance in the case of inject duration.
Using the inject duration table as an example, the ECU first determines which tables are above or below the current advance/retard value in the same was as described above. Then the inject duration interpolated from inject quantity and rpm for the maps on either side of the adv/ret value, and the inject duration values are interpolated to find the fractional duration amount.
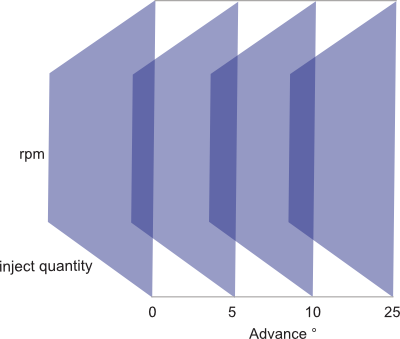
In effect the duration table is a cube with inject quantity, rpm and advance/retard as the three axes (please excuse the wonky illustration!). The first and last duration tables are sides of the cube, and the remaining table(s) divides the space between the sides equally.