The driver demand maps are relatively simple - they convert throttle input (what you the driver are demanding) and engine speed into a requested injection quantity in mg/stroke.
10P and 15P
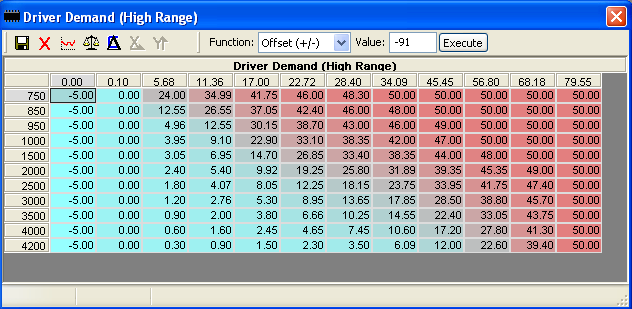
- Driver Demand - High Range
- Driver Demand - Low Range
Axis Values
- X-axis: Throttle %
- Y-axis: Engine Speed (RPM)
- Z-axis: Inject Quantity (mg/stroke)
Using data logging
Nanocom logging does not expose the throttle %, despite the value being returned in the same request as the way voltages.
To approximate the throttle % from TPS 1 voltage:
estThrottle% = 39.5 * TPS1 voltage - 35.55Ignore the negative percentages, as these occur in the dead band of the pedal.
It's not exact. From my logs 2.000V = 43.18% and from the formula above 2.000V = 43.34% (using a three-way pedal).
An alternative method is to use a cheap OBD-II interface to log RPM and Throttle %, as both these items are available as OBD-II PID's.
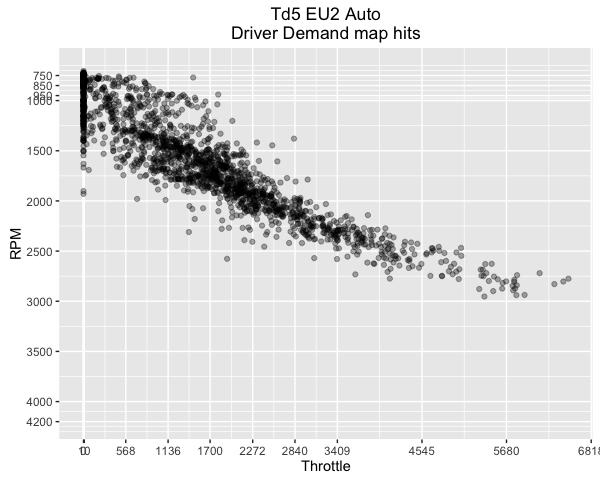
Using the calculated Throttle % and RPM data you can find precisely where on the throttle map you are driving under specific conditions.
As an example, the images below show a scatter plot of the live data for RPM and Throttle % with the breaks set to match axis header values. The corresponding EU2 High Range Driver Demand map is shown beneath the live data.